
Program Planning Model and Framework
The Recreation System in Bellevue
The City of Bellevue operates an extensive parks and recreation system. With over 2,700 acres of parks and open space owned and managed by the city, Bellevue Parks & Community Services helps to foster Bellevue’s identity as a “City in a Park” by offering both passive and active recreation opportunities (see Appendix V: Programs and Services Management Matrix). In addition to city amenities and services, many other public and private recreational and leisure opportunities are available for Bellevue residents to access (See Appendix III: Inventory of Recreation Service Providers).
The recreational system in Bellevue is a complex network of private, non-profit, and public service providers. Each has their own specific focus within the overall market. Most providers find their market niche based on motivations for profit or organizational mission. The Recreation Program Plan places the city’s programmatic emphasis on filling gaps rather than competing with other local providers.
Community Perceptions of City-Provided Recreation
Existing City of Bellevue Data Collection
Survey data are helpful in evaluating Bellevue Parks & Community Services’ role in providing recreation services to Bellevue residents. This role considers the highest and best use of the City of Bellevue’s inventory of indoor and outdoor recreational facilities. It also considers how the department can be a community partner, working with other recreation providers to provide Bellevue residents with the highest level of recreation access possible.
The city of Bellevue’s statistically valid annual performance measures survey has consistently shown that about 90 percent of residents visit a Bellevue park or recreation facility within a 12 month period; 2021 data show an 88% visitation rate. To collect more detailed information, Parks & Community Services conducts a random sample survey every six years to inform planning and decision-making about program and service offerings and future park system development. The most recent iteration of the random sample survey, completed in 2021-22 as part of the 2022 Parks and Open Space System Plan community engagement process, collected data from 469 Bellevue residents to gauge what types of recreation facilities (public or private) are commonly used by community members.
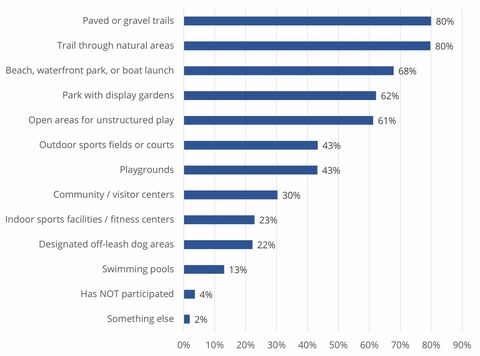
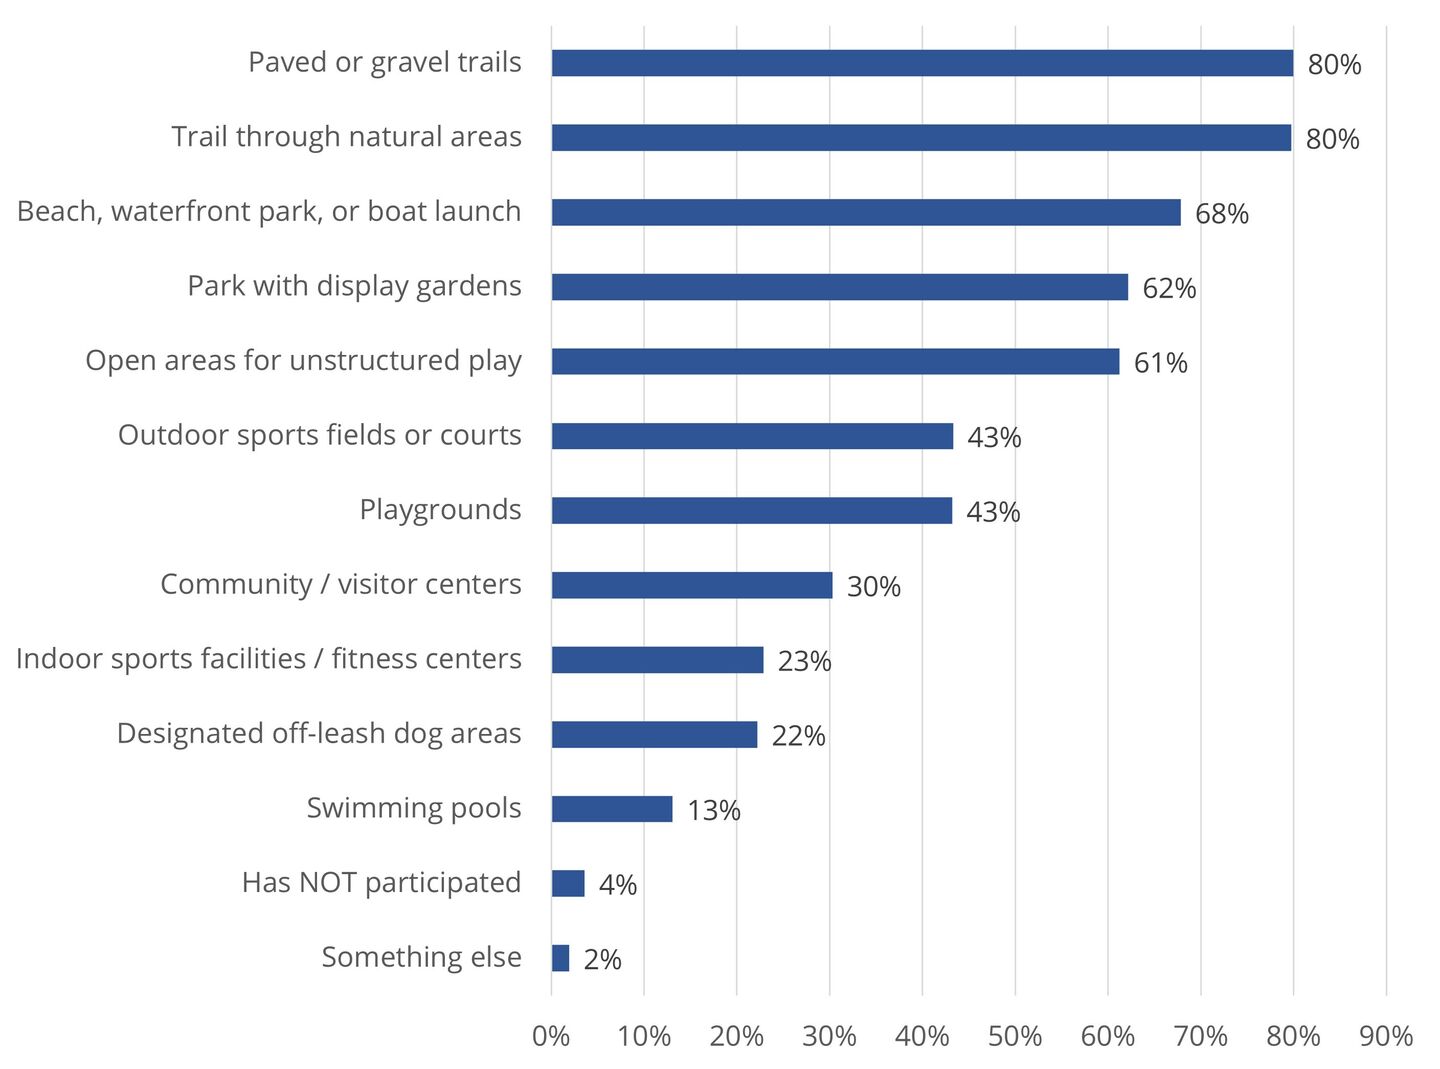
According to the 2021-22 survey, the most commonly used facilities by anyone in the household are:
- multi-use paved or gravel trails (80 percent);
- trails through forests, wetlands, or other natural areas (80 percent);
- community beaches (68 percent);
- parks with display gardens (62 percent);
- and open areas for unstructured play or picnicking (61 percent).
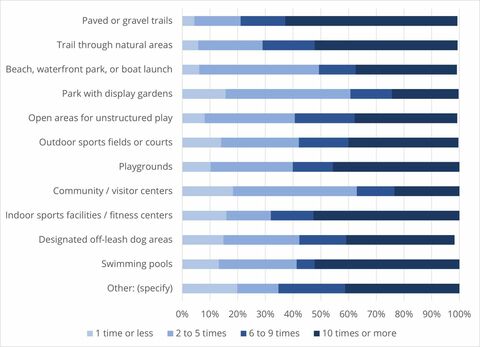
Respondents were also asked how many times they used each type of facility during the year. Many of the most commonly used facilities also saw the most frequent use during the year. A separate question asked about the facilities used within the past 12 months by children under age 18. The top responses include:
- playgrounds (66 percent);
- trails through forests, wetlands, or other natural areas (65 percent);
- and multi-use paved or gravel trails (64 percent);
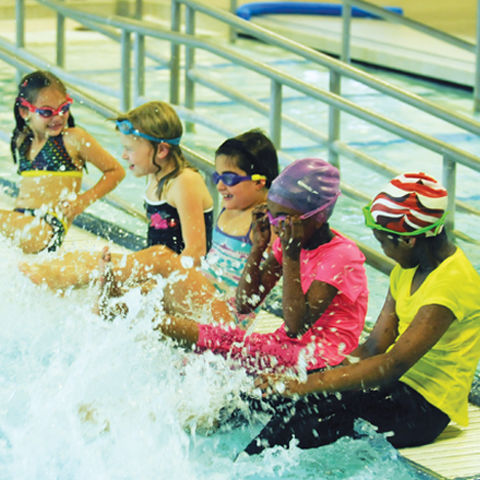
Respondents with children reported more use of playgrounds, outdoor sports fields and courts, and swimming pools. Nearly all residents surveyed reported that Bellevue’s parks and recreation opportunities enhance their quality of life (95 percent).
Figure 1: Use of Parks and Recreation Facilities
2021-22 Survey Question - In the past 12 months, have you or someone in your household visited any of the following types of public or private parks or recreation facilities in Bellevue?
Figure 2: Frequency of Parks and Recreation Facilities Use
2021-22 Survey Question - In the past 12 months, how often have you personally visited the following types of parks or recreation facilities in Bellevue?
The preferences of Bellevue residents are largely consistent with recreation and leisure trends documented both nationally and regionally. The National Recreation and Park Association (NRPA) indicates in their 2023 Engagement with Parks Report that Americans’ top three recreational activities were visiting local parks, playgrounds, dog parks, or other open spaces; hiking, biking, or walking on a trail; and playing basketball, golf, tennis or other sport with family or friends. The Washington State Recreation and Conservation Office (RCO) tracks statewide data on outdoor recreation demand and found in their 2022 State Assessment of Outdoor Recreation Demand Report, which contributed to the 2023 State Recreation and Conservation Plan (SCORP), that the most popular activities in King County were walking/day hiking on trails, walking on roads or sidewalks, wildlife and nature viewing, scenic driving, and hanging out.
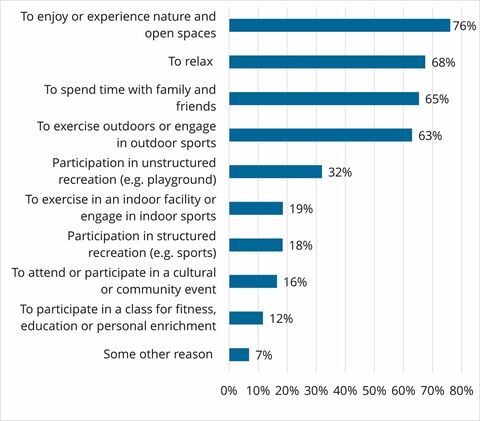
When asked how they use Parks & Community Services facilities, Bellevue residents most commonly indicated that they use them to:
- to enjoy or experience nature and open spaces (76 percent),
- to relax (68 percent),
- to spend time with family and friends (65 percent),
- and to exercise outdoors or engage in outdoor sports (63 percent).
Figure 3: Reasons for Visiting Parks and Recreation Facilities
2021-22 Survey Question-For what purposes did you personally visit a Bellevue park or recreation facility?
Most Bellevue residents said they use parks and facilities primarily for individual or family activities. This reflects national recreation and leisure trends, with NRPA reporting that most Americans spend time in parks or recreation facilities to gather with family and friends, enjoy a break from daily stress, exercise or be physically fit, and be closer to nature.
A survey conducted in conjunction with the 2023 State Recreation and Conservation Plan (SCORP) update asked respondents statewide to choose their top motivations for spending time outside. The top reasons were to exercise, connect with nature, for fun or adventure, for peace and quiet, to improve mental health, and spend time with family, friends, and/or pets. This is consistent with many of the top reasons that Bellevue residents choose to recreate outside.
In 2019, Bellevue respondents reported a slightly higher preference for exercising outdoors (35 percent prefer) than indoors (27 percent), with about a third saying they prefer both equally (35 percent). The 2021-22 resident survey found that a higher portion of residents visit parks to exercise outdoors compared to indoors. It should be noted that the 2021-22 survey was conducted during the Covid-19 pandemic. During this time, many indoor facilities were limited in use. Overall, data shows strong demand for all types of facilities and programs to serve people’s recreational and leisure preferences.
Public Outreach
Bellevue Parks & Community Services conducted significant public outreach in spring and summer 2019 to inform the 2020 Recreation Program Plan. These additional outreach efforts focused on 1) engaging community members who don’t typically participate in city programs, 2) identifying barriers to program participation, and 3) raising awareness about the department’s program offerings. The goal was to gather qualitative data that would lead to equitable and inclusive action items designed by and for all people who interact with the city’s recreation programs, with an emphasis on underrepresented groups. As part of the 2023 update, outreach was supplemented and validated through a series of stakeholder meetings with Bellevue boards and committees.
The methods and strategies used for outreach were informed by existing public participation processes used by the City of Bellevue and a review of literature on community engagement in recreation planning, public sector program evaluation, equitable community engagement, and participatory action research. The outreach effort conducted by the department employed a layered approach of mixed methods including surveys, focus groups, listening sessions, and individual interviews. The diversity of research tools allowed participants to respond in the manner most appropriate and suitable to their needs. All outreach included information on current opportunities for recreation programming and distribution of the department’s Connections program brochure.
Surveys
As part of the public engagement effort, a recreation survey was distributed in 2019 to a wide variety of community members through in-person intercepts, online outreach, and promotion at community centers and other local organizations. The survey included questions related to recreational interests, use of existing Parks & Community Services facilities, program awareness and communication preferences, and barriers to program participation. To increase accessibility and inclusion, the survey was available in digital and hard copy format with translations in Spanish, simplified Chinese, Korean, Hindi, and Russian (the primary languages spoken in Bellevue other than English). While the results of the survey are not statistically valid, they represent a broad diversity of backgrounds and identities.
Parks & Community Services staff conducted intercept surveys at Crossroads Community Center, Mini City Hall (at Crossroads Mall), Highland Community Center, South Bellevue Community Center, and North Bellevue Community Center (including general programming and Chinese Information Service Center and SeaMar programming).
The survey was distributed by employees and leaders in the following organizations, including Bellevue Special Needs PTA, The Arc of King County, NISO Promotores, Asian Counseling and Referral Service, the Islamic Center of Eastside, Kindering Center, Parents and Friends of Lesbians and Gays (PFLAG) Bellevue chapter, Washington State Fathers Network—Bellevue chapter, and the King County Library System. Department staff provided each organization with digital and hard copy versions of the survey through their preferred and routine outreach methods, which included e-newsletters, meetings, in-person programming, listservs, social media, e-mail correspondence, and distribution at designated community information hubs.
Within the City of Bellevue, digital and hard copy surveys were distributed to all Parks & Community Services facilities, the Parks & Community Services Board, the Human Services Commission, the Youth Link Board and Youth Council, the North Bellevue Community Center Advisory Board, the Bellevue Network on Aging, Bellevue Police Department Advisory Councils,
and the Bellevue Diversity Advisory Network. Three hundred seventy-six people responded to the survey between July 31, 2019 and September 30, 2019. Additional information about survey participants and corresponding outreach activity is provided in Appendix II: Summary of Public Outreach Methods.
Focus Groups
Two focus groups were conducted by Hardwick Research in September 2019. The focus groups were designed to assist staff in understanding residents’ awareness of Parks & Community Services programs and to determine their barriers and motivators to participation in recreational programs in general and with the City of Bellevue’s programs in particular. The two focus groups were composed of Bellevue residents who had not participated in a Parks & Community Services recreational program within the past five years. The groups were selected to reflect a variety of ages, income levels, ethnicities, and gender identities. The first group included residents without children under the age of 13, and the second group was dedicated to residents with children under the age of 13. The focus groups discussed topics similar to those included in the survey, namely current recreational habits, awareness of program offerings, barriers to participation, and communication preferences.
Listening Sessions and Interviews
Staff conducted 13 stakeholder meetings between April and October 2019, soliciting input from city boards and commissions, advisory groups, community organizations, and department staff. A full list of listening sessions and interviews is included in Appendix II: Summary of Public Outreach Methods. Stakeholders were asked to share their insights about community recreational interests, barriers to program access, and department marketing and communications.
As part of the 2023 update, staff conducted six meetings between July and October 2023, with city boards and committees. This outreach represented the needs of a broad range of the community and those who are connected most closely to recreation programming issues. Boards and committees included the Bellevue Diversity Advantage Network, the Bellevue Network on Aging, the Parks & Community Services Board, and the Youth Link Board. Stakeholders were asked about their recreational interests, how changes in the city and world since 2020 impacted recreation programs, and any barriers remaining to access programs in follow-up from 2019 engagement.
Results of Recreation Outreach
Information received through public outreach fell into four broad categories: current recreational habits, marketing and program awareness, programming needs, and barriers to access. The qualitative data gathered through public engagement was summarized and evaluated by the planning team to identify and prioritize areas of focus for the recreation program from 2020 to 2026. While outreach tactics and respondents varied widely, several common themes emerged in discussions with residents in 2020. Similar themes emerged from outreach in 2023, with slight nuance from 2020 outreach.
Recreation Habits
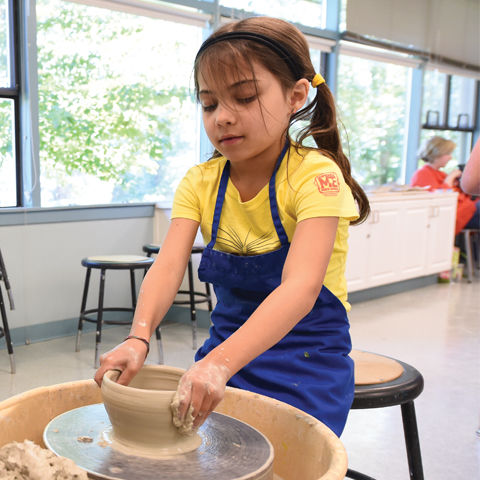
Survey respondents and focus group participants were asked how they like to spend their free time. Responses ranged from outdoor activities such as walking, hiking, biking, exploring parks, gardening, and team sports to pursuits such as reading, language classes, shopping, watching movies, art, music, dance, and indoor athletic activities. Many people indicated that they share these activities with family or friends. This was especially true of respondents with children.
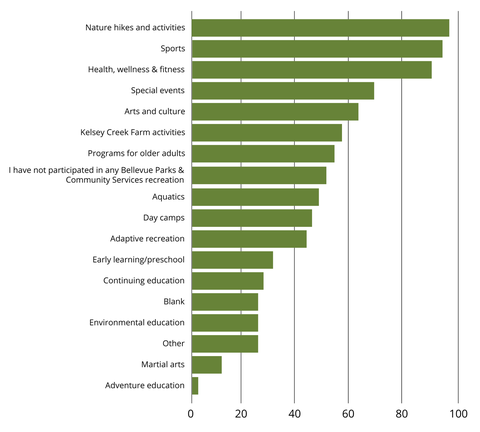
A majority of 2019 survey respondents and many stakeholders interviewed had previously participated in City of Bellevue recreation programming. Approximately 70 percent of survey respondents had participated in a Bellevue Parks & Community Services recreation activity. The most popular activities cited were nature hikes and activities; sports; and health, wellness, and fitness activities; followed by special events and arts and culture activities. Most survey respondents participated in activities at parks and open space, nature trails, community centers, public beaches, and in their own homes.
Figure 4: Participation in Recreation Activities
2019 Survey Question 3: Which Parks & Community Services recreation activities have you participated in?
Marketing and Program Awareness
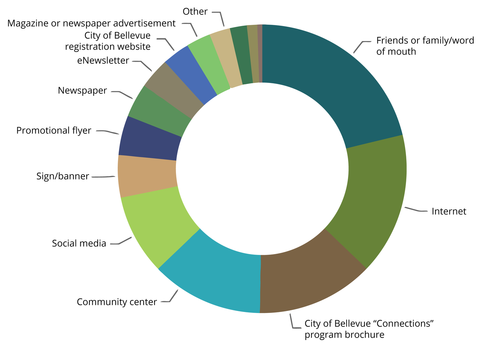
Among 2019 survey participants, word of mouth was the most popular source of information about recreational opportunities. Twenty-one percent reported that they normally learn about programs from family and friends. This was followed by 16 percent who learn about activities from the internet and 13 percent from the department’s program brochure, Connections.
Community centers are also an important place to find out about activities, with 12.5 percent of respondents indicating that they rely on department facilities for information about City of Bellevue programs. Only nine percent of survey participants learn about recreation activities through social media.
Figure 5: Program Awareness
2019 Survey Question 4: Where do you normally find out about recreation activities?
While not focusing solely on recreation programs, the 2021-22 random sample survey conducted as part of the 2022 Parks and Open Space System Plan asked respondents to identify all sources of information that they currently use to find details on local parks, trails, recreational facilities, and programs and then select their preferred method. The top choice for both questions was the internet, currently used by 70 percent of respondents with 45 percent identifying it as their preferred method to find information. Word of mouth from friends and family was cited as the second highest method currently used (48 percent), with 12 percent identifying it as preferred.
Nearly all the 2019 focus group participants noted that they rely on social media, particularly Facebook, for communication about program opportunities. Instagram was also popular in the group with children, while the group without children used Twitter/X, Nextdoor, and Snapchat in addition to Instagram. In general, the Connections brochure was not well-known or used by focus group participants. Once introduced to the brochure, most indicated that a searchable electronic version of the catalog would make it more user-friendly.
In interviews and listening sessions, stakeholders described similar communication preferences, although Connections was much more frequently used by this group. Several interviewees indicated that it is important to preserve a hard copy version of the brochure, particularly for older adults, and to provide additional copies in gathering places such as schools and community centers. A majority of stakeholders expressed an interest in greater digital access to program information and registration, for example through a smartphone app and website.
Most also suggested that a more prominent presence on social media would help them to be more aware of programs and services. The department was asked to continue efforts to provide information in multiple languages and to consider alternative, culturally responsive media formats, for example radio or TV. Lastly, several respondents stressed the importance of personal connections with community leaders and groups and in-person invitations to participate in programs.
Community input continues to indicate that a variety of communication methods are needed to advertise recreation programs. Bellevue residents who already participate in Parks & Community Services programs are more likely to be aware of program offerings and understand how to participate. This group is also more likely to receive program recommendations from family and friends or see programs advertised in places they visit frequently, such as community centers. To effectively reach residents who aren’t regular program participants, the department should explore using social media more extensively and strategically to publicize opportunities and should work to make program information and registration simpler and more easily accessible using digital tools. In 2023, the department implemented a new activity registration and facility scheduling system with built-in accessibility features, which will help the department continue to remove barriers to access.
The department should also continue to develop new materials in formats and with content that is accessible and culturally responsive. In addition, Parks & Community Services should continue to work with existing partners to make hard copy and digital information about programs more easily available in places where people spend a lot of time, for example schools, community- or faith-based organizations, and other centers of civic life.
Programming Needs
In 2019, survey respondents, focus group participants, and interviewed stakeholders were asked if there were any additional recreation activities that they would like to see offered by the city. Many participants indicated that they are happy with the opportunities provided by Parks & Community Services. However, several respondents suggested additional programming needs that they would like the department to consider.
A significant number of community members indicated that it would be beneficial to provide additional opportunities for unstructured play—for example through an increase in unprogrammed gym and field time and increased open drop-in hours at community centers. Several people noted that they would like to see an increase in cross-cultural and cross- generational activities. Some suggested that health-focused programs or cooking classes could be widely appealing for different cultural and age groups, and other respondents stressed the importance of providing integrated facilities that have equipment and spaces that facilitate play and exercise for all ages and abilities.
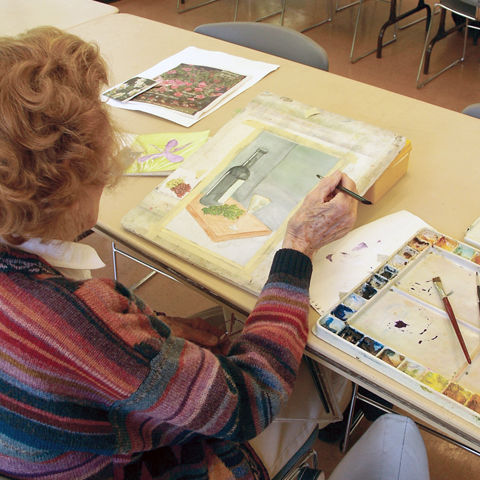
The department was asked to consider developing programs that center the experiences of non-dominant cultures, for example recent immigrants, those of diverse ethnicities and religious backgrounds, those in the disability community, and those in the LGBTQ community, among others. There was also strong interest in additional programs to foster youth skills and leadership development, including experiences that might encourage career exploration and programs that could allow youth to design and develop camps and other activities for themselves. A few respondents highlighted the growing need for programs for people with cognitive impairments, particularly as the baby boomer generation ages. These commenters suggested that the department could provide valuable continuing education and volunteer opportunities that support brain health.
Multiple comments were submitted with specific ideas for new sports facilities or program options, such as additional drop-in times, ranging from courts for badminton, pickleball, racquetball, tennis, basketball, and volleyball to soccer and baseball fields, cricket pitches, bowling lanes, and additional swimming pools (in particular a full-sized pool for competitions). Many of these sports are reflected as future capital objectives in the Parks and Open Space System Plan. Several respondents expressed their interest in other programs that the department already offers, such as community gardening, day camp opportunities, dance, yoga, and art, among others.
The number and variety of responses submitted by the community suggest that Bellevue residents are enthusiastic about recreation opportunities and that program interests are diverse and dynamic. The responses also underscore the importance of regular program reviews to ensure that programs offered by the department are relevant and responsive to community needs.
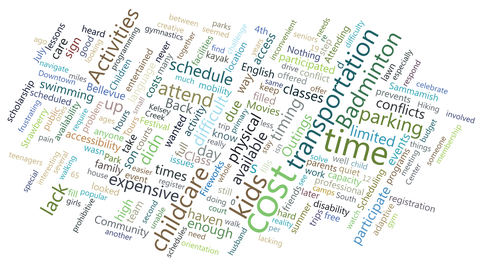
Barriers to Access
A primary focus of the outreach effort was to identify barriers to program participation for Bellevue residents. Parks & Community Services is committed to continuously improving the delivery of programs and services to reach every member of our community. Identifying barriers and systematically working to reduce them will support citywide objectives to provide equitable, accessible, and culturally responsive programs, services, and facilities.
Barriers cited by residents were consistent across survey respondents, focus group participants, and interviewed stakeholders. They fell into four categories, listed below.
Figure 6: Barriers to Participation
2019 Survey Question 6: Think about the last City of Bellevue Parks & Community Services activity that interested you—what barriers prevented you from participating?
Access and Transportation
Access to programs and facilities was a significant barrier reported by respondents of all ages. Although the department strives to provide a geographically distributed system of parks and facilities, program offerings are not necessarily located in all geographic areas and traveling even smaller distances can pose a challenge for people with limited mobility or those without cars. Transit service is not necessarily designed to accommodate access to parks and facilities, and transit options are very limited in certain neighborhoods, in particular in South Bellevue. The additional cost of transit required to participate in programs was also cited as a barrier by some respondents: if an entire family needs to travel roundtrip via bus to a program location, the fare can increase rapidly. In addition, some neighborhoods lack safe and accessible pedestrian and bicycle routes to parks and facilities.
Regional and national data also reflect that transportation is one of the most significant barriers to recreation program participation. The 2019 State of Play report for Seattle and King County, produced by the Aspen Institute and the University of Washington, observes that transportation and cost are the two most substantial challenges faced in providing access to physical activity for young people. The RCO 2022 State Assessment of Outdoor Recreation Demand similarly cites limited access as the second largest barrier to outdoor recreation opportunities among Washington residents of all ages, closely following behind crowdedness of recreation areas.
Cost
The cost of recreation programs was another significant concern described by community members of all ages, especially families with children and older adults on a fixed income. Free programs and financial assistance are offered by Parks & Community Services, and stakeholders expressed interest in maintaining or expanding free or low-cost options. While helpful for many residents, financial assistance provided by the department doesn’t stretch very far, particularly for families with multiple children and for more expensive programs like summer day camps that require up-front payment. The financial assistance application process can be lengthy and can sometimes prevent participants from registering for popular programs that fill quickly.
Some families who don’t qualify for financial assistance because of their higher income level may still find programs unaffordable due to the high cost of living in the Seattle-Tacoma-Bellevue metro area. The cost of transportation and childcare necessary to participate in recreation programming exacerbated the issue of affordability. Respondents also observed that using the word “scholarship” to describe the department’s financial assistance gives older adults the impression that the assistance is only for school-aged children and youth. The department has expanded use of the term “financial assistance” in addition to “scholarship” to more effectively increase awareness of the program across all demographics.
As indicated above, overall cost is cited as a barrier to recreation participation both regionally and nationwide. For the 2018 Outdoor Participation Report, the Outdoor Foundation surveyed Americans over 6 years old and found that the expense of equipment and the cost of accessing outdoor recreation facilities are among the top ten reasons that people don’t get outside. NRPA’s 2023 Engagement with Parks Report lists excessive cost as the fourth-most significant barrier to enjoying parks and recreation, after a lack of time and concerns over safety at facilities or traveling to facilities. The 2019 State of Play research found that 13 percent of youth surveyed in King County have never participated in organized sports or physical activities due to their expense, and another 11 percent indicated that they dropped out of programs due to cost.
Time of Day and Available Free Time
A large and diverse number of respondents cited time as a barrier to participation—both the timing of programs offered and their available free time to participate. Many people expressed frustration with rush hour traffic in and around Bellevue and the challenge or impossibility of getting to programs that are scheduled for time windows after work. However, respondents also indicated that the department should consider offering additional evening programs, especially for older adults who may still be working and are not available during the day. Several individuals indicated that they were simply too busy or had time conflicts with programs they were interested in.
For many of those interviewed, the timing of programs was closely connected to child care needs. For families with both parents working or with single parents, recreation programs for children that don’t fill the full window of the work day create a barrier, as they additionally require supplemental daycare and transportation assistance. Respondents also cited challenges posed by having one child participate in a program without finding a corresponding program for other children in the same location. The issues of transportation, childcare, and time of day were interconnected for many participants.
The department has also heard through both qualitative and quantitative outreach efforts that summer programs are relied upon by many families during the work day. In a customer survey conducted after the 2021 summer day camp season, 47 percent of respondents reported that a primary motivation for registering for summer day camps is to allow a parent and/or caregiver to work. Thirty-five percent of respondents indicated that extended care is a key factor when making a registration decision. Qualitative data from the department’s Wraparound Services Coordinators indicate that lack of extended care is a barrier which prevents lower-income families from accessing summer day camps.
The 2020 Recreation Program Plan identified the time of day for opening of program registration, then set at midnight, as a barrier to access. Since then, a new activity registration and facility scheduling system was implemented, allowing the department to shift registration start time so customers needing assistance have access to staff either in person or over the telephone. Timing will be assessed regularly to ensure that it is meeting the needs of as many users as possible.
A lack of time is identified as an impediment to recreation nationally, as noted above. The 2023 NRPA Engagement with Parks Report finds nationally that a lack of time is a primary impediment to enjoying park and recreation facilities, leading all responses with 33 percent. The 2018 Outdoor Participation Report lists it as the number one reason Americans surveyed don’t take part in recreational activities. The RCO 2022 State Assessment of Outdoor Recreation Demand found that a lack of time and other commitments is the third-largest barrier to participation, with about 41 percent of respondents identifying it.
Communication and Cultural Responsiveness
As noted in the “Marketing and Program Awareness” section, community members learn about program opportunities in a variety of ways. Several people interviewed were not aware of programs offered by the department. Participants identified issues both with delivery of information (i.e., ease of access) and with content. Communication challenges are faced by older adults, who may be isolated and unaware of activities, as well as by recent immigrant groups who may not know about city-provided programs.
Many individuals identified language as a barrier for learning about, registering for, and participating in programs. Nearly all materials are provided in English. Some respondents noted other impediments that could be corrected with more culturally responsive programming, for example activities and facilities that don’t accommodate cultural or religious practices. Community members expressed a clear need for more programs that not only welcome people of diverse identities, but also programs that are grounded in and celebrate their cultures and values in their native languages. Cultural responsiveness is also an issue of safety for many immigrant and refugee communities who lack trust in government.
Language and cultural barriers were also identified in the 2019 State of Play survey in King County, which asked young people whether they had participated in a recreation program or organized sports. Forty-three percent of youth who don’t speak English at home had never participated, compared with 14 percent of youth who speak English at home. Similar to Bellevue, State of Play respondents noted that registration and scholarship materials and systems are often only in English and pose challenges, and many immigrant families are concerned about filling out additional forms and submitting them to recreation agencies
Evaluation of Programs
The city of Bellevue evaluates recreation programming using various tools and methodologies. Numerous performance measures are tracked related to Parks & Community Services, including several directly related to recreation programming. Results are gathered primarily from post-program evaluation surveys offered to registered participants. See Appendix VI: Evaluation Forms for additional detail.
One performance measure – the percent of program participants that rank programs as ‘good’ or better – is a department key performance indicator (KPI). KPIs are a smaller subset of performance measures tracked by the Finance and Asset Management Department and reported to city leadership on a regular basis. The 2022 participant survey yielded a 95 percent rating on this value, consistent with prior years, meeting the target of 90 percent.
Other performance measures related to the suite of recreation programs include the number of registrants for city recreation programs, percent of participants rating various aspects of the program experience as good or excellent, percent of program participants that register online, and total number of children and youth served annually. Trendlines have stayed consistent for most measures. An exception is for measures assessing number of participants served or registered. Rates of participation declined during the Covid-19 pandemic in 2020 and 2021, largely because of public health mandates, department staffing shortages, and reduced facility availability. As of the 2023 Recreation Program Plan update, many values have recovered and are approaching pre-pandemic values.
In addition to reviewing quantitative data, staff regularly review qualitative program feedback from participants in conjunction with general recreation input received from the community. Recreation program staff and other staff also fill out an annual questionnaire to identify progress on each implementation action in this Recreation Program Plan and share accomplishments. All information allows staff to assess individual program performance, how each program fits with the greater suite of programs, and how the program helps to make progress towards the implementation actions in this Recreation Program Plan.
Recreation Planning Process
The planning team evaluated the information gathered during public outreach and established a series of goals, strategies, and actions for Parks & Community Services to undertake between 2020 and 2026. The planning team then conducted a prioritization process to arrive at the final list of actions. Criteria used to prioritize actions included:
Effectiveness and Impact
- How likely is it the action will work to implement the strategy?
- Does the action address multiple goals, or other department or city objectives?
- Does the action provide any efficiencies?
Equity
- Does the action address the needs of historically underrepresented populations and those who are currently underserved?
- Does it help assure equitable access for all residents?
Speed and Urgency
- How quickly will the impact be achieved?
- Does the action leverage a window of opportunity?
Feasibility and Effort
- Is it possible to implement the action with current capacities within the department?
- What is the relative ease of covering the cost of the action with the department budget or other resources?
- Who do we need to talk with to ensure that this action is feasible?
Public and Staff Input
- Does this action reflect feedback received from the public and from staff?
The vision, guiding principles, and goals, strategies, and actions that follow will guide the department in the provision of programs, placing special emphasis on serving the needs of community members who would otherwise have limited opportunities to participate in recreational activities.