
Bellevue's population was estimated to be 145,300 as of April 1, 2019, making it the fifth largest city in Washington, just behind Seattle, Spokane, Tacoma and Vancouver.
Bellevue’s population comprises just under 2% of the state’s total population and just under 7% of King County’s total. The city covers an area of approximately 33.5 square miles, resulting in a population density of 4,335 people per square mile.
Top 10 Largest Washington Cities in 2019
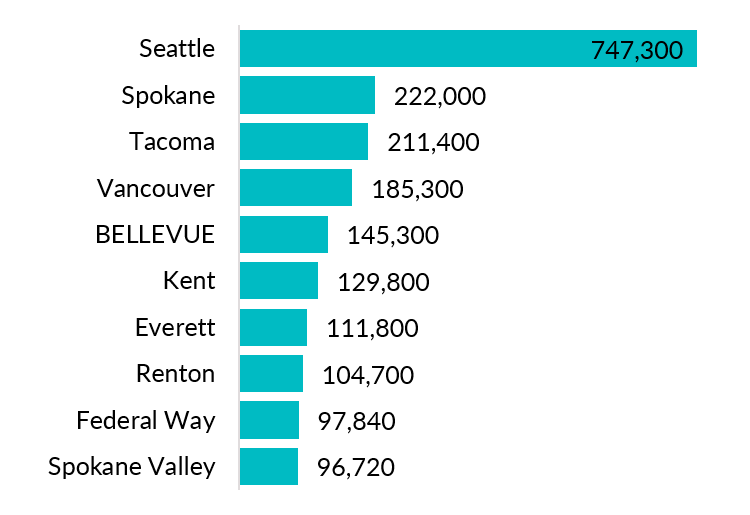
Source: Washington State Office of Financial Management, Population Estimates Division.
Trends and Projections
Since Bellevue incorporated in 1953, the city’s population has grown at an average annual rate of 5% per year. However, much of that growth was due to annexation, especially annexation that occurred during the 1950s and 1960s, when Bellevue quintupled in size, annexing nearly 19 square miles, and the city’s population ballooned by a factor of 10, climbing from 5,950 in 1953 to 61,196 in 1970.
Bellevue Population 1953 to 2019 with Shares of Growth from Annexation and Natural Increase/Immigration, and Forecast Population to 2035
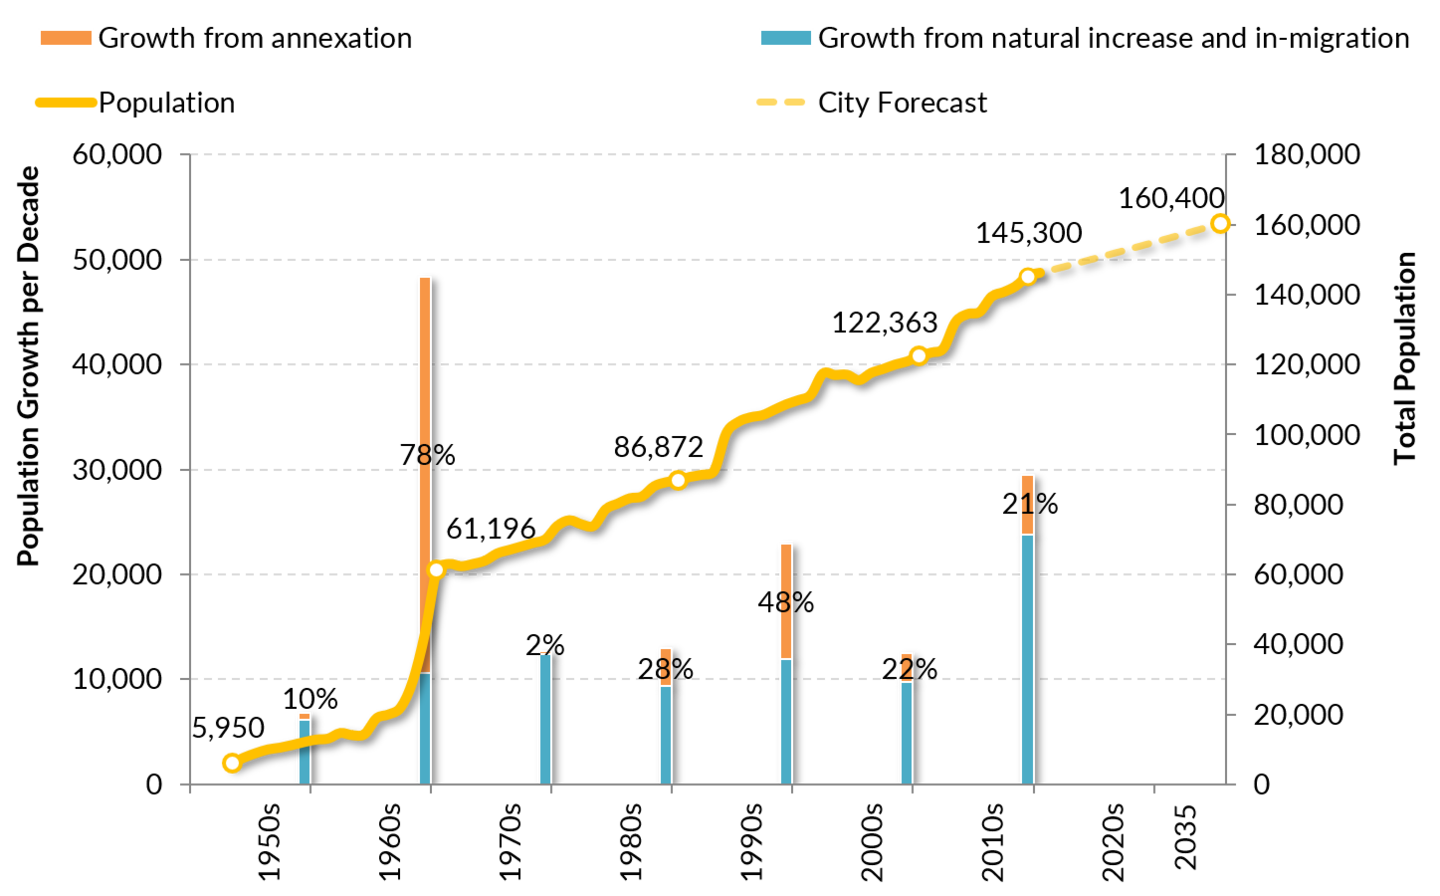
Source: Population estimates prior to 2000 are from the City of Bellevue with decade points from the U.S. Census Bureau. Estimates from 2000 on are from Washington State’s Office of Financial Management. Official population estimates are for April 1st of the specified year. Forecast is from the City of Bellevue’s Comprehensive Plan adopted in July 2015.
Since 1970, annexations have represented 26 percent of Bellevue's population growth, which has grown on average 1.8 percent per year. In the future, Bellevue's rate of population growth is projected to slow to less than one percent per year with total population projected to reach 160,400 by 2035.
Bellevue Annexations 1953 to 2019

Source: City of Bellevue Department of Planning and Community Development.
Native and Foreign born Shares of Population Growth from 1990 to 2017
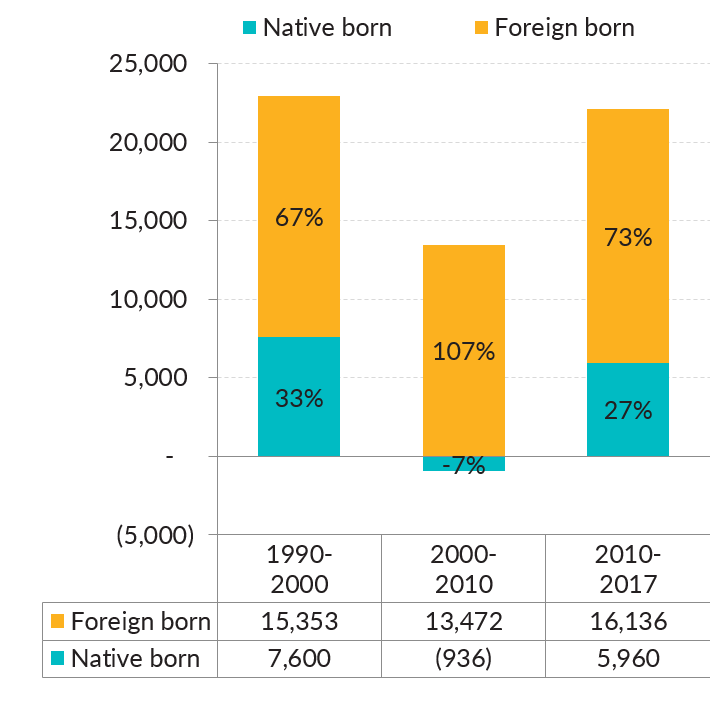
Source: U.S. Census Bureau, 1990 Census, 2000 Census and 2010 Census and 2010 American Community Survey.
For decades, most of Bellevue's residents have come to Bellevue from another state or from abroad. In 1970, about 41 percent of Bellevue's residents had been born in Washington state, while 49 percent had been born in another state, five percent outside of the United States and five percent in a foreign country. Since 1970, the share of Bellevue’s residents who were born in a foreign country has increased steadily climbing from five percent in 1970 to 39 percent in 2017.
Between 1990 and 2000, immigrants from foreign countries comprised about 67% of Bellevue’s population growth. Between 2000 and 2010, immigrants comprised about 107% of Bellevue’s growth, while the native born population shrank in size. This phenomenon occurred in metropolitan areas across the country. Governing magazine found that 37 growing metro areas would have lost population had it not been for new residents from abroad. Since 2010, immigrants have comprised about 73 percent of Bellevue's population growth. With greater shares of people moving to Bellevue from abroad, the cultural background of Bellevue's population has been diversifying.
Comparisons
Between 2010 and 2019, Bellevue’s population, not including population in annexation areas, grew by 14.1%, slower than King County’s population overall at 15.3%, yet faster than the state’s increase of 12.2%. Eastside cities, including Issaquah, Redmond, Newcastle, Kirkland, Sammamish and Renton, all grew faster than Bellevue, while Mercer Island, Woodinville, the Points communities and other small towns grew slower.
Data Sources
Data on population come from two main sources: the United States Census Bureau and state Office of Financial Management.
The Census Bureau’s decennial censuses, which take a 100% count of the population every decade, provide the anchor points from which estimates are generated for following years (postcensal estimates). Once two anchor points exist, the Office of Financial Management creates a new set of annual estimates called intercensal estimates to yield a more consistent series. OFM’s postcensal estimates represent Bellevue’s official population estimates as they determine the level of state funding allocated to the city.
The Census Bureau also provides population and housing estimates each year along with demographic components of change by age, sex, race and Hispanic origin for the nation as part of their population estimates program.