Existing Snapshot
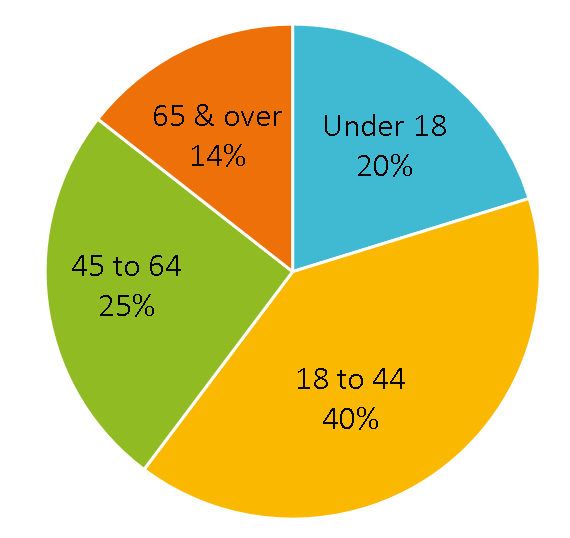
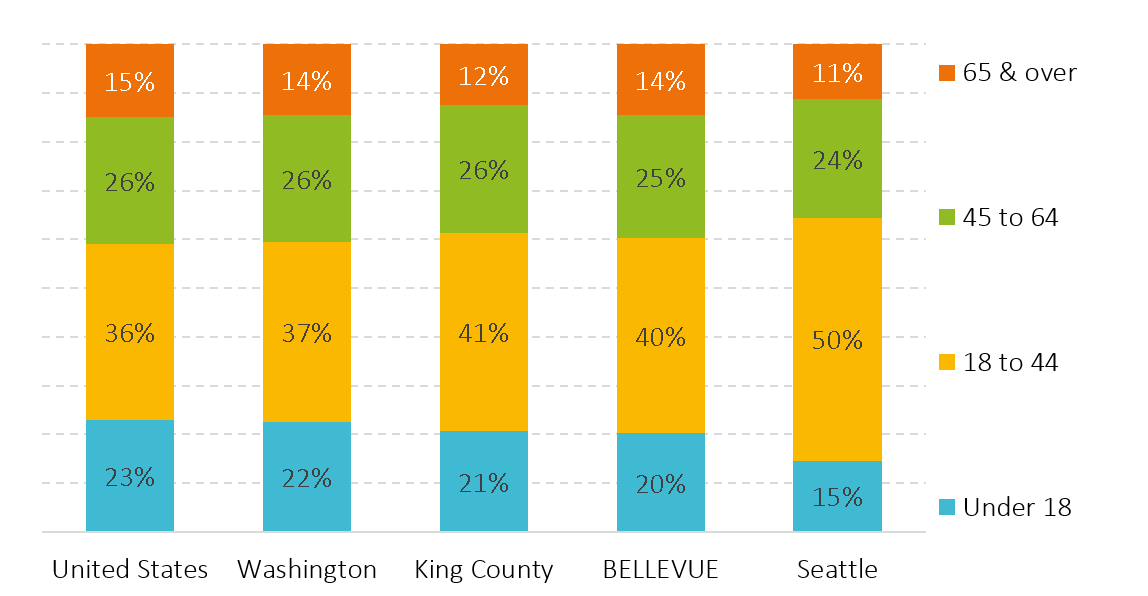
While the number of people within each age cohort has increased over the decades, certain cohorts have grown faster than others resulting in shifts in their proportions over time. In 2015, the proportion of young workforce age residents in Bellevue rose to 40 percent while the proportion of older workforce age residents fell to 25 percent pushing Bellevue’s median age down to 37.4. The proportion of children under 18 also dropped one percent while the proportion of older adults climbed slightly to 14 percent.
Age and Gender
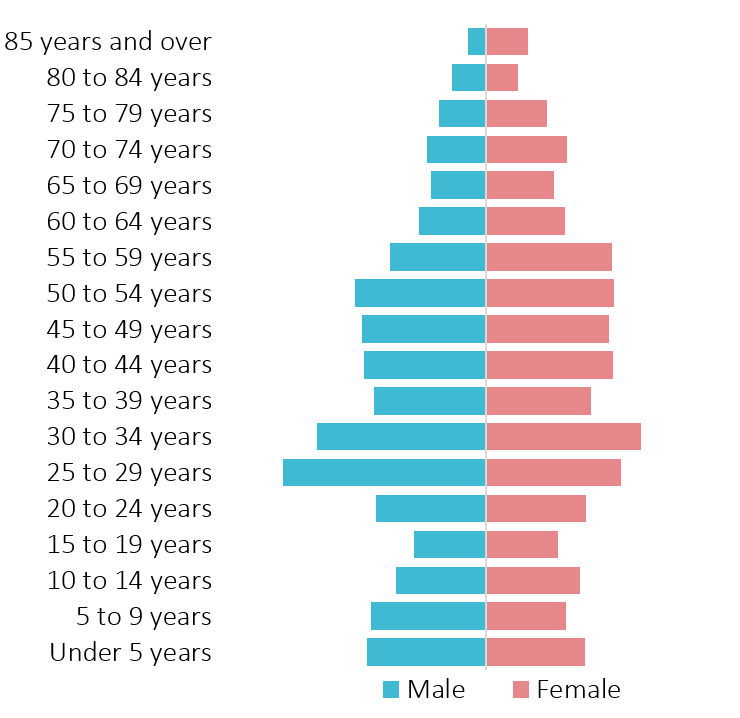
While the median age for Bellevue’s population as a whole was 37.4, the median age for males was 34.8 and the median age for females was 40.7. This can be understood by looking at Bellevue’s age population pyramid to the right, which shows the distribution of the population in five year age increments by gender. While the proportion of males and females was fairly even for Bellevue’s population as a whole, with males comprising 50.6 percent and females 49.4 percent, the split for different age segments of the population varied.
Males outnumbered females in all of the younger age segments except for one (10 to 14) and in the 25 to 29 year age segment there were an estimated 2,760 more males than females. From 55 on up females outnumbered males in all age segments except for one (80 to 84). Males comprised 54 percent of Bellevue’s children under the age of 18 and 53 percent of the population ages 18 to 44, while women comprised 52 percent of the population 45 to 64 and 57 percent of Bellevue’s older adults over the age of 65.
Age and Race/Ethnicity
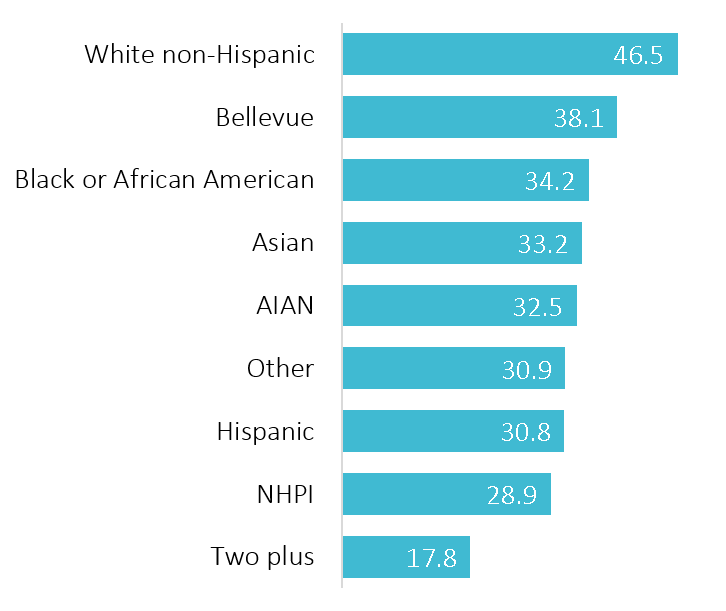
Median Age by Race/Ethnicity, 2011-2015
Age also differed by race and ethnicity with minorities having lower median ages than Bellevue’s non-Hispanic White population. In 2015, Bellevue’s non-Hispanic White population had the highest median age at 45.6, followed by Bellevue’s Black or African American population with a median age of 34.2, Bellevue’s Asian population with a median age of 33.2, Bellevue Hispanic population with a median age of 30.8 and Bellevue’s multi-racial population with a median age of 17.8.
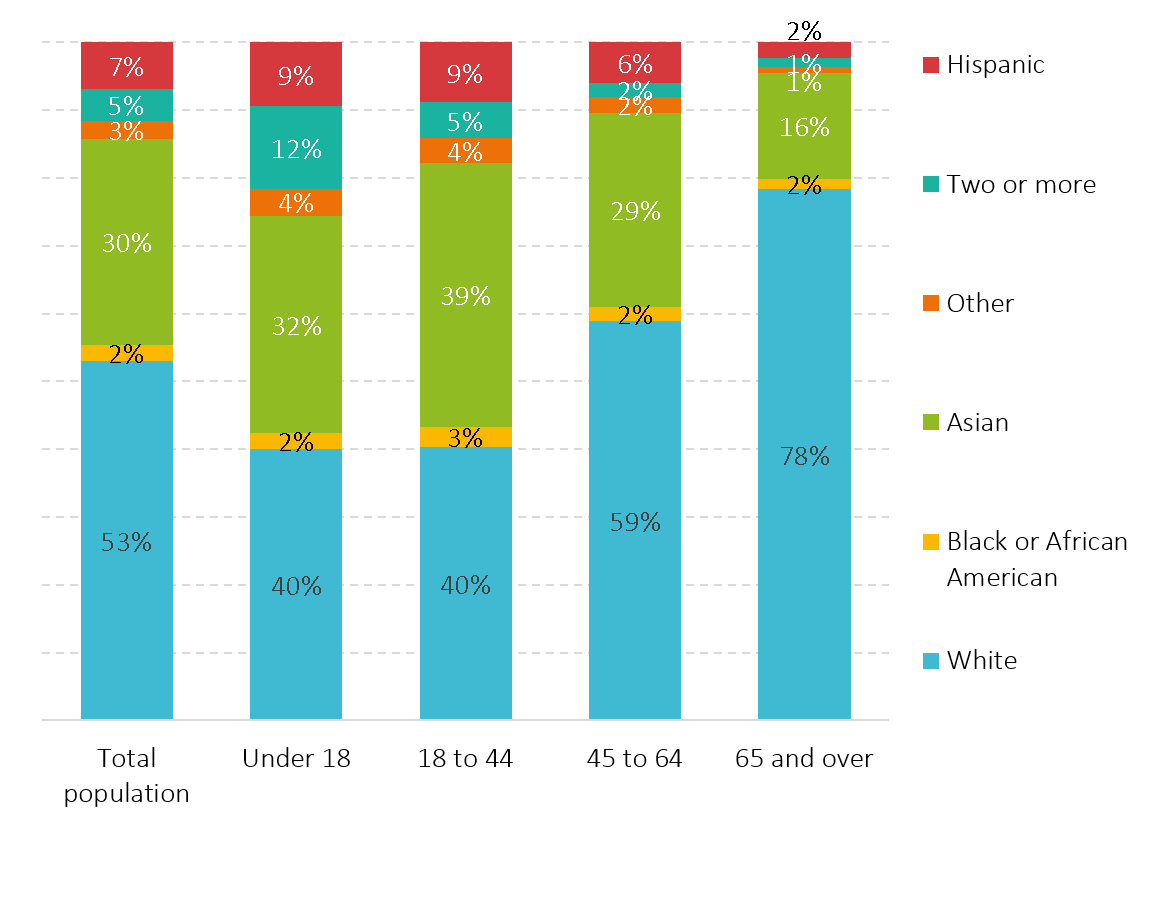
Age distributions likewise varied with race and ethnicity. Bellevue’s children under 18 and its young workforce age population, 18 to 44, both had a plurality of races and ethnicities with non-Hispanic Whites comprising about 40 percent of their populations. Bellevue’s children had a higher percentage of people of two or more races, whereas the young workforce had a higher percentage of Asians. Bellevue’s old workforce age population, 45 to 64, was less racially diverse with non-Hispanic White comprising 59 percent of its population, but Bellevue’s older adults, 65 years and over, were the least racially/ethnically diverse age cohort with 78 percent of their population being non-Hispanic White.
Comparisons
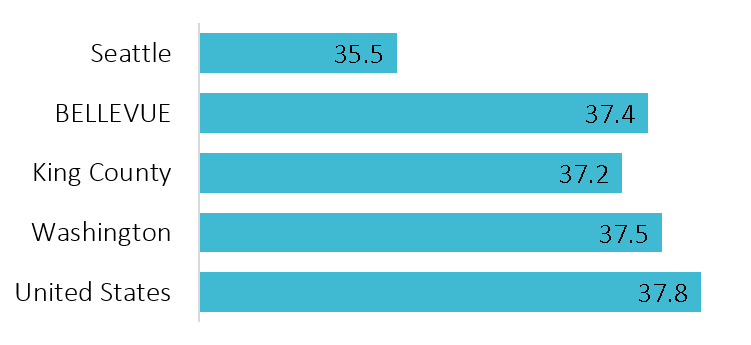
In 2015, the median age of Bellevue’s population was slightly lower than that of the U.S. and Washington State. However, it was slightly higher than King County’s and much higher than the City of Seattle’s as shown in the bar graph to the right.
Bellevue currently has roughly the same age distribution as Washington State and the nation. However, its age distribution differs markedly from that of Seattle’s. As Bellevue urbanizes in the future, one question is whether its age distribution will remain similar to the state’s and nation’s or whether it will become more similar to Seattle’s, with smaller proportions of children and older adults.
Trends and Projections
In 1970, the City of Bellevue was still young in terms of the life cycle of a city. Most neighborhoods were filled with new homes occupied by first-time home buyers and nearly 57 percent of its households were comprised of married couple families with children. This occasioned over 41 percent of its population to be under the age of 18, another 39 percent between the ages of 18 and 44, 17 percent between the ages of 45 and 64 and only three percent being 65 years or older.
As the city matured, so did its residents creating greater diversity in the age distribution of the population. By 1980 young adults had become the largest age cohort and remain so today, yet their proportion declined from 1990 to 2010 as the older workforce (45 to 64) and older adults (65 plus) increased in size. The year 2015 was fist time this age cohort witnessed an increase in its share of the population.
As baby boomers continue to age, the proportion of older adults within Bellevue is expected to increase, further evening out and diversifying the age distribution within the city. Nationwide, older adults are projected to comprise over 20 percent of U.S. residents by 2030 and if projections hold true, by 2056 the population 65 and older would outnumber people younger than 18 for the first time in U.S. history. Pew Research Center has an animated graphic depicting the nation’s changing age distribution from 1950 to 2060.
Whether Bellevue will witness the same rate of increase in its older adult population as the state and nation is difficult to predict. As jobs in Bellevue's IT cluster grow, Bellevue will continue to attract the young, educated and relatively well paid workforce. This new young population could simply be added on top of Bellevue's existing population, or it could displace some of Bellevue's older residents who may be looking to downsize and/or find more affordable housing options.
Data Sources
Data on demographics come from the United States Census Bureau's decennial censuses and American Community Survey. While the decennial census happens only once every ten years, the American Community Survey (ACS) is an ongoing survey that provides vital information on a yearly basis about the American people and workforce. It helps local officials, community leaders and businesses understand the changes taking place in their communities. See Bellevue's ACS Demographic and Housing data profile here.
